Automated GPU Health Monitoring with NVIDIA NVSentinel on the Rafay Platform

GPU clusters are expensive and GPU failures are costly. In modern AI infrastructure, organizations operate large fleets of NVIDIA GPUs that can cost tens of thousands of dollars each. When a GPU develops a hardware fault (e.g. a double-bit ECC error, a thermal throttle, or a silent data corruption event), the consequences ripple outward: training jobs fail hours into a run, inference latency spikes, and expensive hardware sits idle while engineers scramble to diagnose the root cause.

Traditional monitoring catches these problems eventually, but rarely fixes them. Diagnosing and remediating GPU faults still requires deep expertise, and remediation timelines are measured in hours or days. For organizations running AI workloads at scale — and especially for GPU cloud providers who must deliver uptime SLAs to their tenants — this gap between detection and resolution translates directly into SLA breaches, lost revenue, and eroded customer trust.

NVIDIA's answer to this challenge is NVSentinel — an open-source, Kubernetes-native system that continuously monitors GPU health and automatically remediates issues before they disrupt workloads.

In this blog, we describe how Rafay integrates with NVSentinel enabling GPU cloud operators and enterprises to deploy intelligent GPU fault detection and self-healing across their entire fleet — consistently, repeatably, and at scale.

Rafay and NVSentinel

As AI workloads continue to scale, the bottleneck is no longer just raw GPU availability. Increasingly, performance depends on how efficiently GPUs can communicate across nodes. That is especially true for large model training, distributed inference, and pipeline-parallel workloads that rely heavily on high-bandwidth, low-latency interconnects.

NVIDIA’s ComputeDomains introduce a Kubernetes-native abstraction for managing multi-node NVLink-connected GPU communication dynamically. Rather than forcing platform teams to preconfigure static communication groupings between nodes, ComputeDomains enable Kubernetes to allocate and tear down those groupings as part of workload scheduling.

This shift has important implications for performance, utilization, isolation, and the operational model of large-scale AI platforms.

Infra Gap


The Infrastructure Gap for AI Platforms

Kubernetes has become the default control plane for modern infrastructure, including GPU-backed environments. But traditional Kubernetes scheduling is still mostly centered on node-local resources such as CPU, memory, storage, and device counts.

That model starts to break down for modern AI systems. In rack-scale systems such as NVIDIA’s GB200 NVL72, GPUs are no longer best viewed as isolated devices attached to individual servers.

Through NVLink, they are part of a larger connected fabric that enables high-speed communication across GPUs and, increasingly, across node boundaries. In practice, that means a distributed workload may care less about “how many GPUs are free” and more about “which GPUs can communicate efficiently as a coordinated compute domain.”

That distinction matters because many AI jobs do not simply request GPU capacity. They implicitly require:

  • Fast cross-GPU communication,
  • Coordinated memory access,
  • Workload-scoped isolation, and
  • Topology-aware placement.

Without fabric awareness in the orchestration layer, platform teams are left bridging the gap manually.


Static Configuration in Kubernetes

Historically, enabling secure, high-bandwidth GPU communication across multiple nodes has required a fair amount of manual planning. Infrastructure operators had to predefine how workloads would map to node groups and how communication permissions would be set up between them.

That works very poorly in a Kubernetes world.

Kubernetes is designed for dynamic placement, rescheduling, elasticity, and failure recovery. Static node-to-node communication domains work against those strengths. They introduce operational rigidity, increase the burden on cluster admins, and make it harder to share expensive GPU infrastructure efficiently across multiple teams or tenants. For AI platform teams, the result is a familiar tradeoff:

  • Preserve flexibility and sacrifice performance-aware placement,
  • Optimize for interconnect performance and accept a more brittle operational model.

ComputeDomains are meant to remove that tradeoff.


What Compute Domains do

At a high level, ComputeDomains extend NVIDIA’s Dynamic Resource Allocation (DRA) driver to make Kubernetes aware of cross-node NVLink-enabled communication requirements. When a distributed job is scheduled, the platform can automatically create a communication domain around the nodes that host that workload. When the job finishes, the domain is removed.

Under the hood, this is tied to NVIDIA’s Internode Memory Exchange Service (IMEX), which manages GPU memory permissions across nodes. In earlier implementations, IMEX domains had to be configured manually. ComputeDomains effectively bring that lifecycle into the Kubernetes control plane.

The result is a simpler model:

  1. A workload requests distributed GPU resources.
  2. Kubernetes schedules the workload on eligible nodes.
  3. A matching compute domain is created automatically.
  4. The job gets the communication and memory-sharing capabilities it needs.
  5. The domain is torn down when the workload completes.

That is a meaningful step forward because the communication fabric becomes a dynamic, workload-scoped resource, rather than a static infrastructure construct.

Compute Domains Lifecycle


Why does this Matter?

ComputeDomains are interesting for three reasons.

1. Make GPU scheduling more Topology-aware

Traditional GPU scheduling mostly focuses on quantity. Distributed AI workloads, however, often care just as much about connectivity and communication bandwidth.

ComputeDomains push the platform toward a more accurate scheduling model, one that better reflects how large-scale GPU systems actually behave. Instead of merely assigning accelerators, the control plane begins to account for how those accelerators work together as a communication fabric.

2. Improve Shared-cluster Utilization

Static partitioning of high-performance GPU fabrics often leads to fragmentation and idle capacity. Clusters reserve topology-specific resources for certain workloads even when those resources are not being fully used.

By creating communication domains dynamically, the platform can align resource allocation more closely with actual demand. That makes it easier to run shared AI infrastructure efficiently without hard-coding cluster topology into every workload deployment.

3. Strengthen Isolation for Multi-tenancy

In large shared GPU environments, performance is only one concern. Isolation matters just as much.

ComputeDomains help create isolated communication zones around a workload so that neighboring jobs cannot access GPU memory spaces outside their assigned domain. For enterprises operating multi-tenant AI platforms, that is a significant capability. Strong isolation has to be part of the design, not an afterthought layered on later.

Multi Tenancy


How Kubernetes Needs to Evolve for AI

The larger takeaway is not just about one NVIDIA feature. It is about where AI infrastructure is headed.

The classic Kubernetes model assumes that compute is mostly node-local and that devices are consumable as independent resources. Modern AI hardware challenges that assumption. Increasingly, the meaningful resource is not a single GPU but a connected set of GPUs with specific bandwidth and latency characteristics.

As that becomes the norm, orchestration has to evolve as well. ComputeDomains are an example of that evolution.

This represents a move from "Device-centric" allocation to "Fabric-aware" allocation with workload-scoped communication and isolation built into scheduling.

That direction is likely to influence not just high-end training clusters, but eventually a broader set of AI platform architectures as distributed inference and larger model serving topologies become more common.


Operational Considerations

NVIDIA’s current implementation requires Kubernetes 1.32 or later and Container Device Interface (CDI) support. NVIDIA has also indicated that the feature is still evolving, with more work planned around elasticity and fault tolerance.

That means platform teams should view ComputeDomains as an important architectural direction rather than a finished end state.


Summary

AI infrastructure is becoming more fabric-centric, more distributed, and more dependent on interconnect performance. As that happens, the orchestration layer cannot remain blind to communication topology.

ComputeDomains are a notable step toward making Kubernetes more aware of how modern GPU systems actually operate. By dynamically creating and managing workload-scoped communication domains for NVLink-connected GPUs, NVIDIA is moving multi-node GPU fabrics closer to becoming a first-class platform resource.

NVIDIA Dynamo: Turning Disaggregated Inference Into a Production System

In Part 1, we covered the core idea behind disaggregated inference. That architectural split is no longer just a research pattern. Disaggregated inference changes inference from a simple “deploy a container on GPUs” exercise into a distributed system problem.

Once prefill and decode are separated, the platform has to coordinate routing, GPU-to-GPU KV cache transfer, placement, autoscaling, service discovery, and fault handling across multiple worker pools. NVIDIA Dynamo provides the distributed inference framework for this, and Kubernetes provides the control plane foundation to operate it at scale. 

In this blog post, we will review NVIDIA's Dynamo project with a focus on what it does and when it it makes sense to use it.

NVIDIA Dynamo Logo

OpenClaw and NemoClaw: A Better Way to Consume AI Services Through Token Factory

As AI adoption accelerates, most businesses do not actually want to manage GPU clusters, model serving stacks, or low-level infrastructure. What they want is simple, reliable access to powerful models through tools their teams can use immediately. That is exactly the value of combining OpenClaw and NVIDIA NemoClaw with a service provider’s deployment of Rafay Token Factory.

OpenClaw is the user-facing interface where people interact with models and AI assistants. NemoClaw extends that experience with additional security and control for long-running or always-on agents. In both cases, the user experience can remain simple: connect to the provider, use tokens, and start working.

The complexity of GPUs, inference infrastructure, scaling, and capacity planning stays behind the scenes. OpenClaw is the open-source AI agent platform, while NVIDIA describes NemoClaw as an open-source reference stack for running OpenClaw more safely with policy-based privacy and security guardrails.

OpenClaw with Token Factory

Introduction to Disaggregated Inference: Why It Matters

The explosive growth of generative AI has placed unprecedented demands on GPU infrastructure. Enterprises and GPU cloud providers are deploying large language models at scale, but the underlying inference serving architecture often can't keep up.

In this first blog post on disaggregated inference, we will discuss how it differs from traditional serving, why it matters for platform teams managing GPU infrastructure, and how the ecosystem—from NVIDIA Dynamo to open-source frameworks—is making it production-ready.

Disaggregated Inference

Understanding Model Deployment Metrics in Rafay's Token Factory

When you're running LLM inference at scale, "the model works" is table stakes. What separates a demo from a production service is knowing how well your models perform under real-world conditions — how fast users see the first token, whether streaming feels natural, and whether your infrastructure is meeting the service-level objectives you've committed to. That's exactly where inference metrics come in.

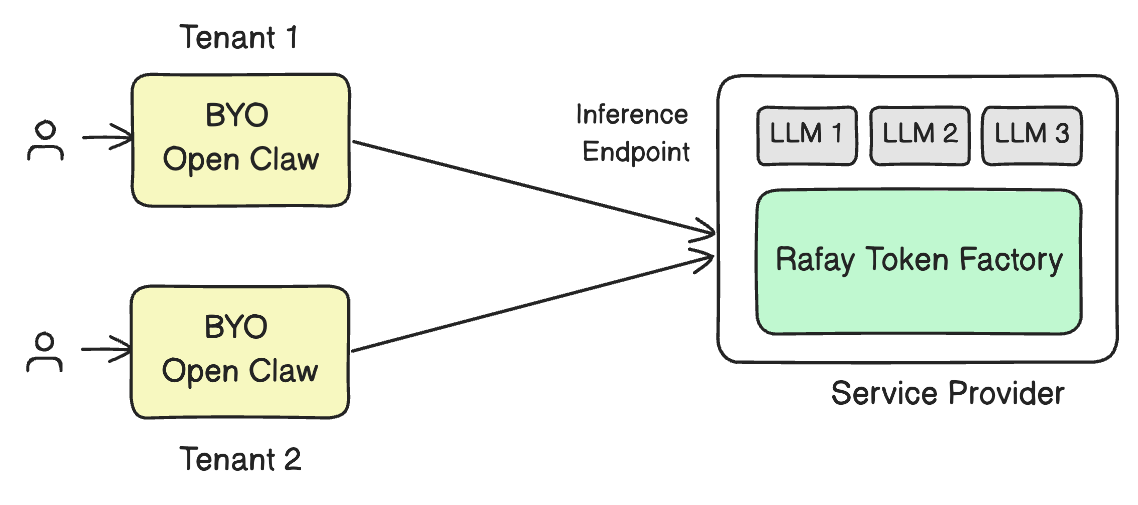
Rafay's Token Factory transforms raw GPU infrastructure into governed, consumable AI services. It enables organizations to deploy models from sources like Hugging Face or NVIDIA NGC as production-grade APIs in minutes, with built-in multi-tenancy, token-metered billing, and auto-scaling. But shipping a model as an API is only half the story.

The other half is observability: knowing, in real time, whether your inference endpoints are performing within acceptable bounds. The Token Factory's built-in metrics dashboard gives operators exactly this visibility — surfacing the key latency, throughput, and resource utilization metrics that matter most.

This blog post breaks down the metrics available in the Rafay Token Factory, explains what each one tells you (and what it doesn't), and walks through a real example so you can interpret your own dashboards with confidence.


The Metrics That Matter for LLM Inference

Before diving into the Rafay dashboard, it helps to understand the core metrics categories for any LLM inference system. These fall into four groups: latency metrics, throughput metrics, percentile metrics, and resource utilization metrics. Each answers a different question about your system's health.

Note

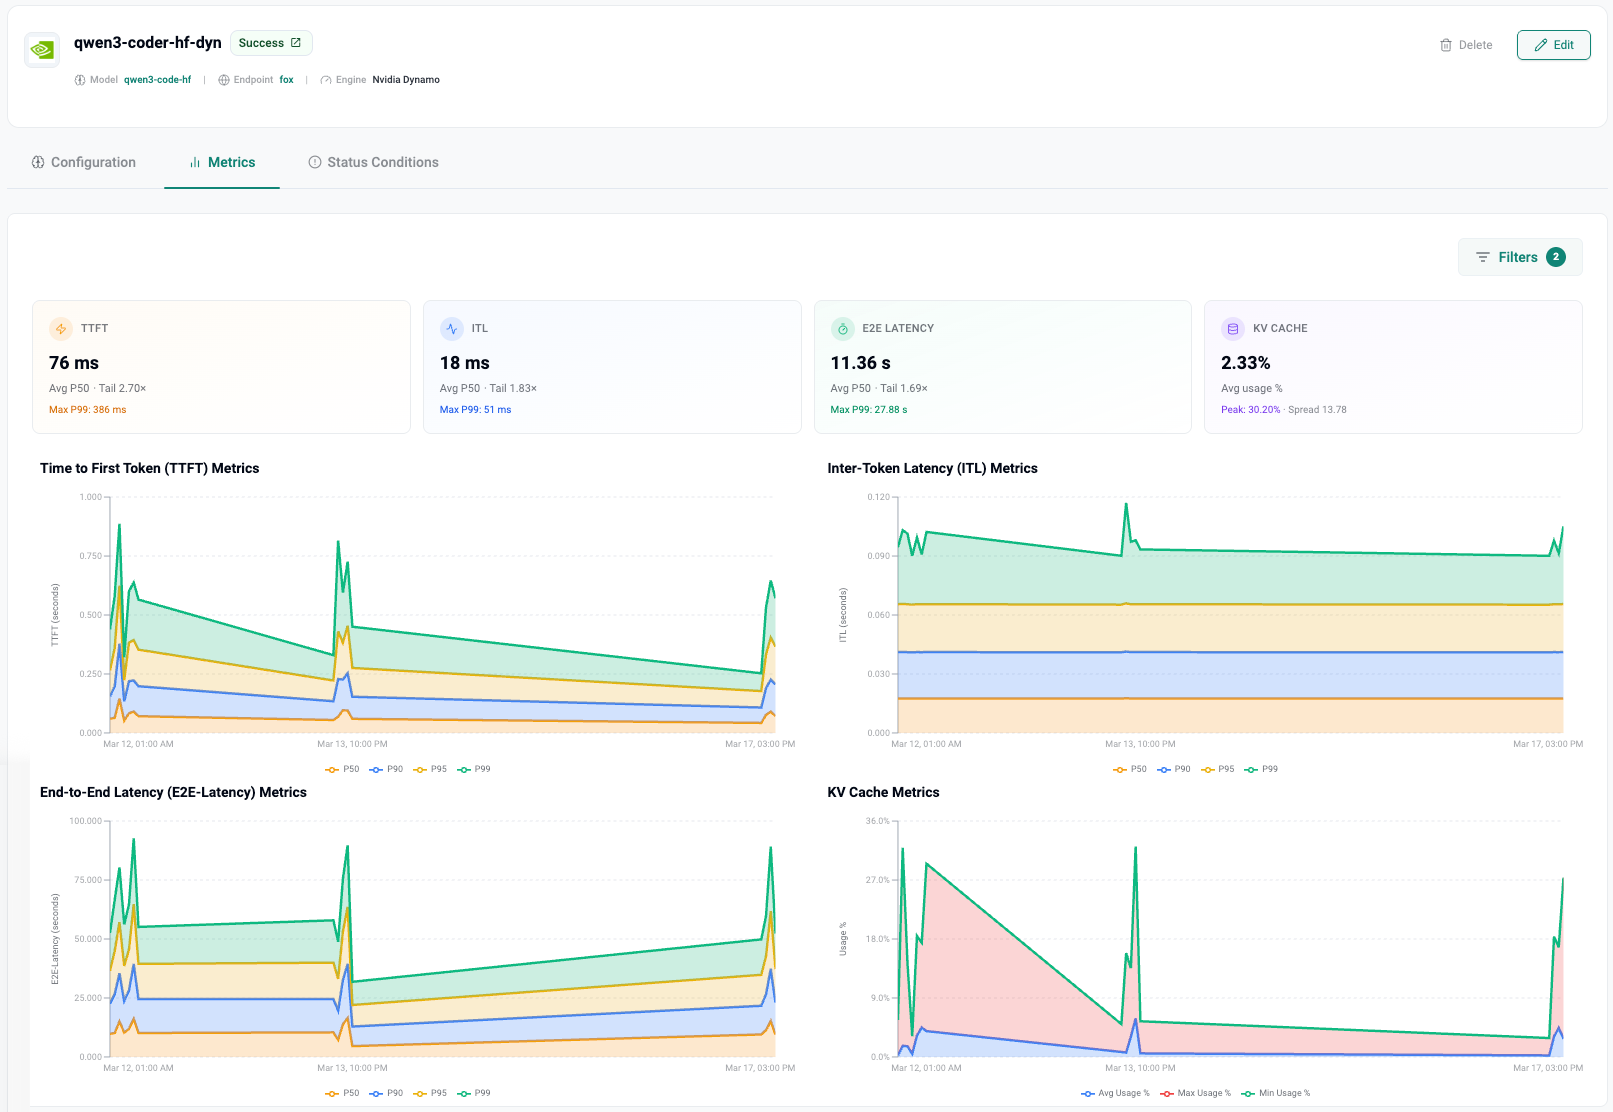
The image below is a real life metrics dashboard in the Rafay Token Factory. We will use this as an example for this blog.

Token Factory Metrics


1. Latency Metrics: What Users Actually Feel

Latency is the metric class that directly impacts user experience. There are three complementary latency metrics, each answering a different question about the request lifecycle.

TTFT — Time to First Token

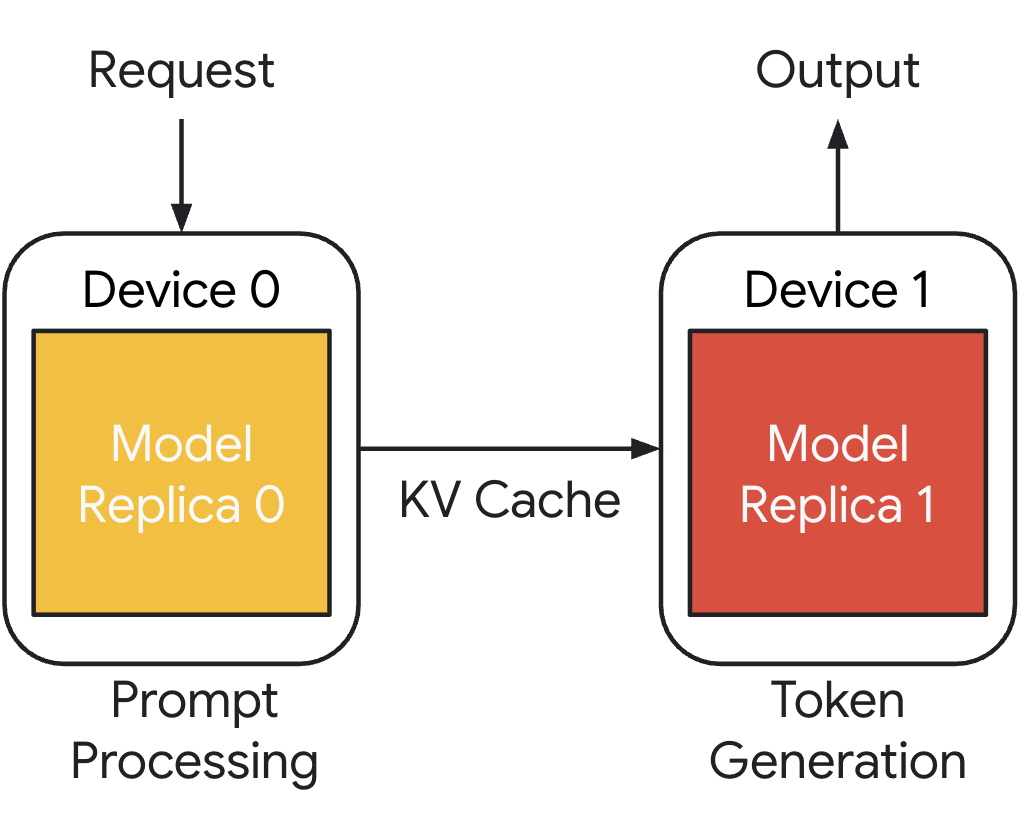
TTFT measures the elapsed time between when a request is submitted and when the very first token of the response arrives. It captures three things: queue wait time, the model's prefill computation (where the entire input prompt is processed to populate the KV cache), and network overhead.

Why it matters: TTFT is what users feel first. In a chatbot, coding assistant, or any interactive application, a long TTFT creates a perception of lag before anything starts appearing on screen. For interactive workloads, the general industry target is a p95 TTFT under 500ms. Anything above that, and users start wondering if the system is broken.

What drives it up: longer input prompts (more prefill work), high queue depth under load, or insufficient GPU capacity for the model size.


ITL — Inter-Token Latency (also called TBT or TPOT)

ITL measures the time between consecutive generated tokens during the decode phase. While TTFT tells you how long before the response starts, ITL tells you how smooth the response feels as it streams.

Human reading speed is roughly 4–5 tokens per second, which means an ITL up to about 200ms is acceptable. Above 250ms, streaming starts to feel choppy or broken. For coding assistants where users read faster, you want even lower values.

Crucially, ITL is a property of the decode phase only — it excludes the first token. As output length grows, the KV cache expands, and attention computation cost increases linearly with the total sequence length so far. This means ITL can degrade over very long outputs.


E2E Latency — End-to-End Latency

E2E latency is the total time from request submission to the final token being delivered. It's the complete picture:

E2E Latency = TTFT + (ITL × number of output tokens)

This is the number your SLAs are typically measured against. While TTFT and ITL help you diagnose where latency is coming from, E2E latency is what your customers and downstream services actually experience.

It's the metric that shows up in your service-level agreements and the one your CFO will ask about.


2. How Rafay Surfaces These Metrics

In the Rafay Token Factory, each model deployment gets its own dedicated Metrics tab within the deployment detail view. The dashboard is designed to give operators both an at-a-glance summary and deep time-series visibility.

The Summary Cards

At the top of the metrics dashboard, four summary cards provide a quick health check:

  • TTFT — Shows the average (p50) value and a "Tail" ratio indicating how much worse the slowest requests are compared to the median. For example, a TTFT of 76 ms with a Tail of 2.70× means the average request gets its first token in 76ms, but the slowest requests take about 2.7 times longer. The Max P99 is also displayed (e.g., 386 ms) to show the worst-case scenario.

  • ITL — Displays the average inter-token latency with its own tail ratio. A value like 18 ms with a Tail of 1.83× indicates very smooth streaming with minimal variance. A Max P99 of 51 ms confirms the decode phase is well-behaved even under pressure.

  • E2E Latency — Shows total request completion time. A value like 11.36 s is typical for longer responses (remember: this includes all output token generation). The tail ratio here (e.g., 1.69×) tells you how consistent the end-to-end experience is. Max P99 of 27.88 s reveals what the unluckiest users encounter.

  • KV Cache — Displays average GPU memory used for KV cache as a percentage. This is a resource metric unique to LLM inference — more on this below.


The Time-Series Charts

Below the summary cards, the dashboard presents four detailed time-series charts, each plotting values across p50, p90, p95, and p99 percentiles over time:

  • Time to First Token (TTFT) Metrics — Watch for spikes in the p99 line (shown in green in the dashboard). If the p50 stays flat but the p99 spikes, you're likely hitting queue contention during traffic bursts. Consistent elevation across all percentiles suggests the model or hardware is undersized for the workload.

  • Inter-Token Latency (ITL) Metrics — This chart should ideally show tight banding between percentiles. Wide gaps between p50 and p99 indicate inconsistent decode performance, possibly due to KV cache pressure, memory bandwidth saturation, or interference from concurrent requests. A healthy ITL chart looks like a narrow, flat band.

  • End-to-End Latency (E2E) Metrics — This chart reflects both TTFT and ITL behavior combined. It's the most variable chart because output lengths differ across requests. Look for the overall trend rather than individual spikes.

  • KV Cache Metrics — Tracks average, max, and min KV cache usage over time. This is your early warning system for memory pressure. If KV cache usage consistently climbs toward its peak or shows high variance, you may need to increase GPU memory allocation, reduce max sequence length, or add more replicas.


3. Percentile Metrics: Why Averages Will Mislead You

One of the most important things the Rafay dashboard does is display metrics at multiple percentile levels rather than just averages. Understanding why this matters is critical for operating production inference services.

p50 (Median)

The median represents the typical user experience — 50% of requests are faster, 50% are slower. It's great for dashboards and getting a general sense of performance. But it's terrible for SLAs. If your p50 TTFT is 76ms, that sounds great — until you realize the other half of your users might be waiting much longer.

p95

This is where 95% of requests fall below. The p95 captures what your "unlucky" 5% of users experience — and in production, that 5% adds up to a lot of real people. Most production SLA agreements are written against p95 values. If you're only tracking p50, you're blind to the experience of a significant portion of your users.

p99

The p99 reveals near-worst-case performance. It catches tail latency spikes that can indicate systemic issues: GC pauses, KV cache evictions, request queuing, or cold starts. If your p99 is healthy and consistent, you can be confident your system is stable. This is the metric to monitor if you want to actually sleep at night.

The rule of thumb: p50 is for dashboards. p95 is for SLAs. p99 is for sleeping at night.


4. KV Cache: The Metric Most Teams Miss

The KV cache metric is less well-known than latency metrics, but it's arguably the most important resource-level indicator for LLM inference. The KV cache stores the key-value pairs computed during the attention mechanism — it's what allows the model to "remember" the context of the conversation during token generation.

Here's why it matters:

  • Memory bound: The KV cache grows with both input length and output length. For models with long context windows, KV cache memory can exceed the memory required for the model weights themselves.

  • Throughput ceiling: When KV cache usage approaches capacity, the system can no longer accept new concurrent requests. This directly limits your throughput (requests per second) and can cause request queuing, which inflates TTFT.

  • Eviction and preemption: When KV cache memory is exhausted, inference engines like vLLM must either evict cached entries (losing prefix caching benefits) or preempt running requests. Both degrade performance.

In the Rafay dashboard, the KV Cache chart shows average usage %, peak usage %, and the spread between them. A deployment showing 2.33% average with a 30.20% peak tells you the system has plenty of headroom most of the time but experiences periodic spikes — likely correlated with bursts of concurrent long-context requests.

Watch for:

  • Sustained high average: You're running close to capacity. Consider adding replicas or reducing max sequence length.
  • Large spread between average and peak: Bursty workloads. Ensure your auto-scaling policies can respond fast enough.
  • Monotonically rising average: Possible memory leak or growing session lengths. Investigate request patterns.

5. Optimizing by Workload Type

Not all inference workloads are created equal. The metrics you prioritize should depend on what you're building.

Interactive Workloads (Chat, Agents, Coding Assistants)

For interactive applications, user perception is everything. The north star metric is TTFT p95 < 500ms, followed closely by ITL p95 < 250ms to ensure streaming feels natural. Write your SLAs against p95 values and monitor p99 for early warning signs. E2E latency matters, but users tolerate longer total response times if the streaming experience is smooth.

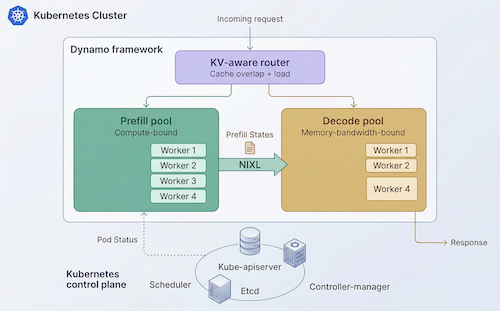
Rafay's Token Factory supports inference engines like vLLM and NVIDIA NIM with dynamic batching and NVIDIA Dynamo for distributed optimization — all tuned to keep these latency metrics tight.

Batch and Offline Workloads (Pipelines, Evals, Data Generation)

For batch processing, latency is secondary to efficiency. The north star metrics are Tokens Per Second (TPS) and cost per million tokens. You want to maximize GPU utilization and minimize idle time. Goodput — the throughput that actually meets your SLO requirements — matters more than raw TPS. High TPS with bad latency equals low goodput.

Rafay's auto-scaling and multi-tenancy capabilities allow you to run batch workloads alongside interactive services, sharing GPU resources while maintaining isolation and governance.


6. Reading the Dashboard: A Practical Walkthrough

Let's walk through what a real Rafay Token Factory metrics dashboard tells us, using the example of a Qwen3 Coder model deployed with NVIDIA Dynamo as the inference engine.

At a glance: The summary cards show TTFT at 76ms (p50), ITL at 18ms, E2E at 11.36s, and KV cache at 2.33%. This deployment is performing well — TTFT is well under the 500ms interactive threshold, ITL is very smooth (18ms means roughly 55 tokens per second of streaming speed), and KV cache has plenty of headroom.

Looking deeper: The TTFT time-series chart reveals an interesting pattern — a spike early in the observation window (p99 briefly hitting ~1 second) that quickly resolved. This could indicate a cold start, an auto-scaling event, or a temporary burst of traffic. The subsequent flattening shows the system stabilized.

The ITL chart shows remarkably tight banding between p50 and p95, with the p99 line sitting close to the pack. This is a sign of a well-configured decode pipeline with minimal interference between concurrent requests.

The KV Cache chart shows a dramatic peak early on (around 30%) that settled into a low-utilization pattern. This correlates with the TTFT spike — during the initial burst, many concurrent requests filled the KV cache, causing brief queuing. Once load normalized, cache usage dropped and latencies improved.


7. From Metrics to Action

Metrics are only valuable if they drive decisions. Here's a quick reference for what to do when metrics go sideways:

TTFT is high: Check queue depth and request arrival rate. Consider adding replicas, enabling prefix caching, or reducing input prompt sizes. If TTFT is high only at p99, you may have bursty traffic that needs faster auto-scaling response.

ITL is degrading: Look at KV cache utilization and GPU memory bandwidth. Long output sequences grow the KV cache, increasing per-token attention cost. Consider reducing max output length or upgrading to GPUs with higher memory bandwidth (e.g., H100 over A100).

E2E latency exceeds SLO: Decompose into TTFT + (ITL × tokens). Identify which component is contributing most and address accordingly.

KV Cache near capacity: Add replicas, reduce max sequence length, enable more aggressive cache eviction policies, or consider quantization (INT8/FP8) to reduce per-token cache size.


Conclusion

Running LLM inference in production isn't just about deploying a model — it's about continuously understanding and optimizing how that model performs under real-world conditions. Rafay's Token Factory provides the metrics infrastructure to do exactly this, giving operators visibility into the latency, throughput, and resource utilization characteristics that determine whether an inference service is truly production-grade.

The key takeaways:

  • TTFT, ITL, and E2E latency are your three latency lenses — each reveals different aspects of performance.
  • Percentiles matter more than averages — always look at p95 and p99, not just medians.
  • KV cache is your hidden bottleneck — monitor it as closely as latency.
  • Optimize for your workload type — interactive and batch workloads have fundamentally different north star metrics.
  • Use the Rafay dashboard's time-series charts to correlate events, spot trends, and catch problems before your users do.

With Rafay's Token Factory surfacing these metrics out of the box — alongside the platform's built-in auto-scaling, multi-tenancy, and token-metered billing — operators have everything they need to run inference services that don't just work, but work well.

Info

Click here to learn more about Rafay's Token Factory

Fine Tuning as a Service using Rafay and Unsloth Studio

Fine-tuning large language models used to be an exercise reserved for teams with deep MLOps expertise and bespoke infrastructure. With Unsloth Studio — an open-source web UI for training and running LLMs — the barrier to entry has dropped considerably.

But packaging Unsloth Studio into a repeatable, self-service experience that neo clouds and enterprise can offer their end users? That still requires thoughtful orchestration.

In this post, we walk through how to deliver Unsloth Studio as a one-click, app-store-style experience using Rafay's App Marketplace. By the end, you'll understand how to create an Unsloth Studio App SKU, configure it for end users, test it, and share it across customer organizations — all without requiring your users to know anything about Kubernetes, Docker, or GPU scheduling.

Unsloth Studio in Rafay

Running GPU Infrastructure on Kubernetes: What Enterprise Platform Teams Must Get Right

KubeCon + CloudNativeCon Europe 2026, Amsterdam


If you are at KubeCon this week in Amsterdam, you are likely hearing the same question repeatedly: how do we actually operate GPU infrastructure on Kubernetes at enterprise scale? The announcements from NVIDIA — the DRA Driver donation, the KAI Scheduler entering CNCF Sandbox, GPU support for Kata Containers expand what is technically possible. But for enterprise platform teams, the harder problem is not capability. It is operating GPU infrastructure efficiently and responsibly once demand arrives.

This post is written for platform teams building internal GPU platforms — on-premises, in sovereign environments, or in hybrid models. You are not just provisioning infrastructure. You are governing access to some of the most expensive and constrained resources in the organization.

At scale, GPU inefficiency is not accidental. It is structural:

  • Idle GPUs that remain allocated but unused
  • Over-provisioned workloads consuming more than needed
  • Fragmented capacity that cannot satisfy real workloads
  • Lack of cost visibility and accountability

Solving this requires more than infrastructure. It requires a governed platform model.

Advancing GPU Scheduling and Isolation in Kubernetes

KubeCon + CloudNativeCon Europe 2026, Amsterdam


At KubeCon Europe 2026, NVIDIA made a set of significant open-source contributions that advance how GPUs are managed in Kubernetes. These developments span across: resource allocation (DRA), scheduling (KAI), and isolation (Kata Containers). Specifically, NVIDIA donated its DRA Driver for GPUs to the Cloud Native Computing Foundation, transferring governance from a single vendor to full community ownership under the Kubernetes project. The KAI Scheduler was formally accepted as a CNCF Sandbox project, marking its transition from an NVIDIA-governed tool to a community-developed standard. And NVIDIA collaborated with the CNCF Confidential Containers community to introduce GPU support for Kata Containers, extending hardware-level workload isolation to GPU-accelerated workloads. Together, these contributions move GPU infrastructure closer to a first-class, community-owned, scheduler-integrated model.